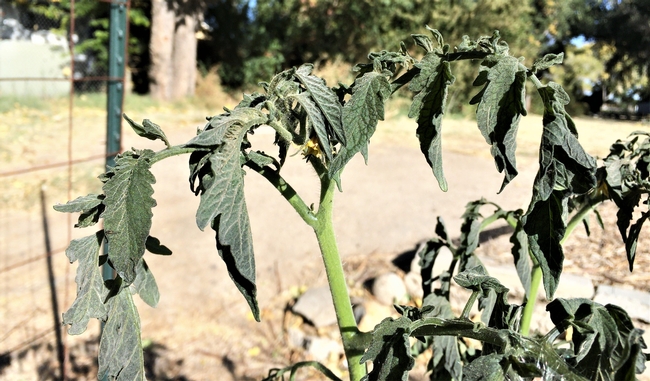
It's now October so that means that we're now in the time of year where we start to wind down our gardens for the season. If you're at all like me and refuse to plan for the eventual coming cold weather by pulling out plants, a killing frost will force the matter.
For most of the Eastern Sierra, at least places where gardening is feasible, October brings us our first frost of the season.
I am often asked about first and last frost dates for various communities. The good news is I have that information. The bad news is that there is wide variability in the actual date. That means it's important to keep an eye on the weather forecast.
Average First Frost Dates
There are two ways to think about frost dates. Here is the first and conceptually easiest to understand: Average first frost date along with an estimate of the spread of when that might happen. The table below shows the average first frost of fall and a range of dates that shows where there is about a 70% chance the the real frost date will fall.
First Fall Frost Dates
|
Typical Frost Window (≈70% Chance) |
||||
| Town | Average Date |
Std. Deviation (± days) |
Early | Late |
| Independence & Lone Pine | 11/3 | 14 | 10/20 | 11/17 |
| Bishop (Airport) | 10/13 | 13 | 9/30 | 10/26 |
| Lee Vining | 10/11 | 13 | 9/28 | 10/24 |
| Topaz Lake | 9/21 | 30 | 8/22 | 10/21 |
Big Pine is about the same average date as Bishop—maybe a little later—but it varies much more. We don't have any data, but that's a observation from gardeners there.
It's also worth noting that the data for Topaz Lake isn't that great, and the station isn't in the best location for predicting effects to your garden. That said, the whole area has a lot of variation every year, making predictions hard. This data is a good place to start.
A Probability Approach
The other way to look at frosts is to consider some level of risk that you are comfortable and then check which date corresponds with that risk level for your location. The Western Regional Climate Center has extensive data and risk projections for many locations in California. (Here is the data: https://wrcc.dri.edu/summary/Climsmcca.html )
Below is an example for Bishop, California.
- Follow the link to WRCC's page
- Choose a station from the list
- On the left side you will see various reports. Fall 'Freeze' Probability will generate a report like above. Scroll down some to see it. It's under the Temperature heading.

